Statistics
Search Engine Market Share Statistics (2010 to 2026)
Real search engine market share from StatCounter, 2010 to 2026: Google vs Bing, Yahoo, DuckDuckGo and Yandex, worldwide and US, updated October 2026.

By Mohamed Ezz CEO & Founder Jun 16, 2024

Search engine market share in 2026: Google holds 90.42% of worldwide search and Bing 4.85% (January to September average), according to StatCounter Global Stats.
Last updated: October 10, 2026. All market share figures on this page are calculated from StatCounter monthly data (all platforms), averaged per calendar year. 2026 values marked with * are the January to September 2026 average.
Key takeaways
- Google's yearly average has stayed between 89.81% and 92.63% of worldwide search from 2010 to 2026. Its two weakest years were 2014 (89.81%) and 2025 (89.92%), and 2026 so far sits at 90.42%.
- Bing is at its highest worldwide share ever: 4.85% in 2026 so far, and 5.29% in September 2026, its best single month in StatCounter's data. In the US, Bing averages 9.53% in 2026, its highest yearly share since 2014 (9.90%).
- In the US, Google fell from 88.57% (2023) to 85.39% (2026 to date), a real, measurable decline, though far from the collapse some headlines suggest.
- Yahoo declined from 3.95% worldwide in 2010 to 1.36% in 2026. DuckDuckGo grew from zero to 0.71% worldwide and 1.73% in the US.
- AI assistants (ChatGPT, Perplexity, Copilot, Gemini) are not counted in these numbers, because StatCounter measures referral based search engine share. Their impact shows up indirectly: fewer clicks per search and Google's 2024 and 2025 dip.
Current snapshot (September 2026)
In September 2026, Google held 89.94% of worldwide search, Bing 5.29%, Yahoo 1.36%, Yandex 1.31%, DuckDuckGo 0.74% and Baidu 0.44%, according to StatCounter.
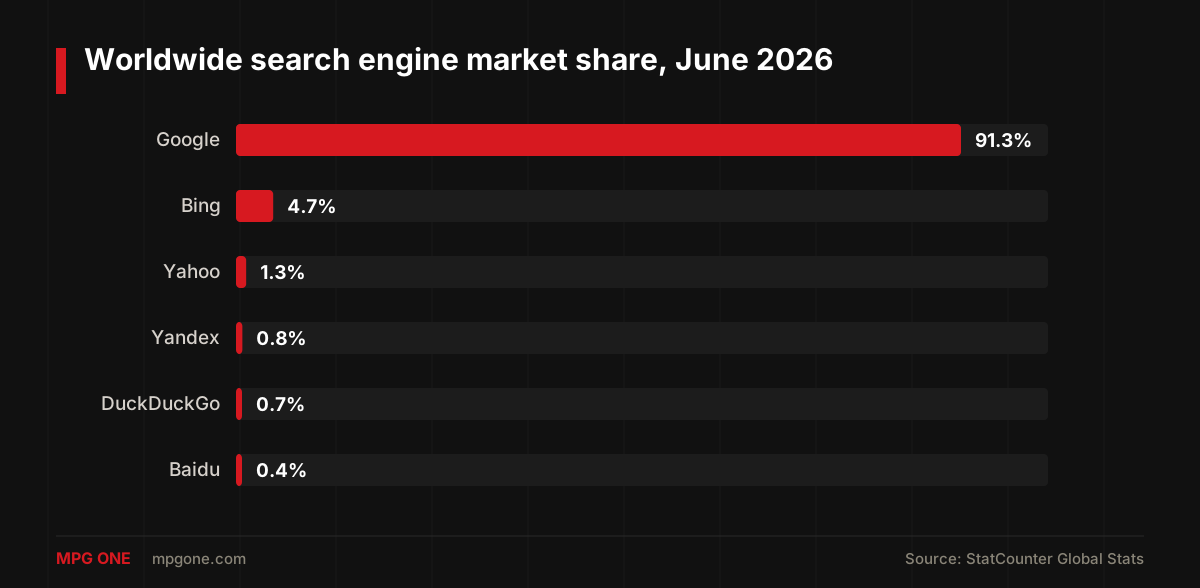
| Search engine | Worldwide share (September 2026) |
|---|---|
| 89.94% | |
| Bing | 5.29% |
| Yahoo | 1.36% |
| Yandex | 1.31% |
| DuckDuckGo | 0.74% |
| Baidu | 0.44% |
Worldwide search engine market share by year (2010 to 2026)
Google's worldwide share moved from 90.89% in 2010 to 90.42% in 2026 so far, while Bing grew from 3.46% to 4.85%, according to StatCounter.
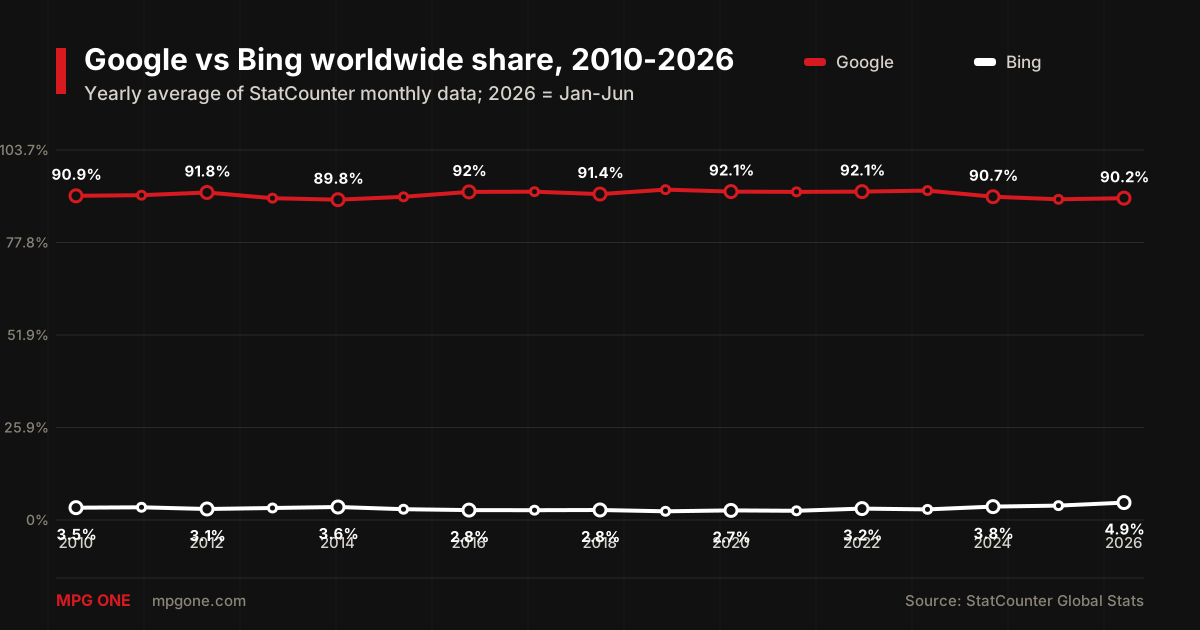
| Year | Bing | Yahoo | Yandex | Baidu | DuckDuckGo | |
|---|---|---|---|---|---|---|
| 2010 | 90.89% | 3.46% | 3.95% | 0.27% | 0.34% | 0.00% |
| 2011 | 91.07% | 3.57% | 3.59% | 0.30% | 0.32% | 0.00% |
| 2012 | 91.84% | 3.09% | 3.01% | 0.38% | 0.36% | 0.00% |
| 2013 | 90.24% | 3.37% | 3.12% | 0.59% | 0.87% | 0.01% |
| 2014 | 89.81% | 3.64% | 3.58% | 0.65% | 0.61% | 0.04% |
| 2015 | 90.61% | 3.02% | 3.40% | 0.71% | 0.96% | 0.11% |
| 2016 | 92.00% | 2.78% | 2.63% | 0.68% | 1.03% | 0.12% |
| 2017 | 92.06% | 2.75% | 2.11% | 0.81% | 1.37% | 0.18% |
| 2018 | 91.39% | 2.81% | 2.16% | 0.90% | 1.44% | 0.29% |
| 2019 | 92.63% | 2.44% | 1.83% | 0.93% | 1.00% | 0.42% |
| 2020 | 92.08% | 2.69% | 1.63% | 1.08% | 1.16% | 0.49% |
| 2021 | 92.01% | 2.58% | 1.50% | 1.10% | 1.46% | 0.62% |
| 2022 | 92.08% | 3.20% | 1.36% | 1.07% | 0.93% | 0.65% |
| 2023 | 92.36% | 2.98% | 1.16% | 1.36% | 0.77% | 0.54% |
| 2024 | 90.65% | 3.75% | 1.22% | 1.94% | 0.87% | 0.61% |
| 2025 | 89.92% | 4.03% | 1.37% | 2.22% | 0.70% | 0.83% |
| 2026* | 90.42% | 4.85% | 1.36% | 1.20% | 0.53% | 0.71% |
Search engine market share by year, in plain numbers
- In 2010, Google held 90.89% of the global search market, Bing 3.46% and Yahoo 3.95%, according to StatCounter. In the United States, Google averaged 81.55% and Bing 8.03%.
- In 2011, Google held 91.07% of the global search market, Bing 3.57% and Yahoo 3.59%, according to StatCounter. In the United States, Google averaged 81.13% and Bing 8.24%.
- In 2012, Google held 91.84% of the global search market, Bing 3.09% and Yahoo 3.01%, according to StatCounter. In the United States, Google averaged 81.70% and Bing 8.58%.
- In 2013, Google held 90.24% of the global search market, Bing 3.37% and Yahoo 3.12%, according to StatCounter. In the United States, Google averaged 80.16% and Bing 9.67%.
- In 2014, Google held 89.81% of the global search market, Bing 3.64% and Yahoo 3.58%, according to StatCounter. In the United States, Google averaged 80.16% and Bing 9.90%.
- In 2015, Google held 90.61% of the global search market, Bing 3.02% and Yahoo 3.40%, according to StatCounter. In the United States, Google averaged 81.40% and Bing 8.45%.
- In 2016, Google held 92.00% of the global search market, Bing 2.78% and Yahoo 2.63%, according to StatCounter. In the United States, Google averaged 85.68% and Bing 6.68%.
- In 2017, Google held 92.06% of the global search market, Bing 2.75% and Yahoo 2.11%, according to StatCounter. In the United States, Google averaged 87.23% and Bing 6.60%.
- In 2018, Google held 91.39% of the global search market, Bing 2.81% and Yahoo 2.16%, according to StatCounter. In the United States, Google averaged 86.84% and Bing 6.77%.
- In 2019, Google held 92.63% of the global search market, Bing 2.44% and Yahoo 1.83%, according to StatCounter. In the United States, Google averaged 87.94% and Bing 6.14%.
- In 2020, Google held 92.08% of the global search market, Bing 2.69% and Yahoo 1.63%, according to StatCounter. In the United States, Google averaged 87.98% and Bing 6.64%.
- In 2021, Google held 92.01% of the global search market, Bing 2.58% and Yahoo 1.50%, according to StatCounter. In the United States, Google averaged 88.11% and Bing 5.96%.
- In 2022, Google held 92.08% of the global search market, Bing 3.20% and Yahoo 1.36%, according to StatCounter. In the United States, Google averaged 87.21% and Bing 6.91%.
- In 2023, Google held 92.36% of the global search market, Bing 2.98% and Yahoo 1.16%, according to StatCounter. In the United States, Google averaged 88.57% and Bing 6.64%.
- In 2024, Google held 90.65% of the global search market, Bing 3.75% and Yahoo 1.22%, according to StatCounter. In the United States, Google averaged 87.72% and Bing 7.38%.
- In 2025, Google held 89.92% of the global search market, Bing 4.03% and Yahoo 1.37%, according to StatCounter. In the United States, Google averaged 86.10% and Bing 7.98%.
- In 2026 so far (January to September), Google held 90.42% of the global search market, Bing 4.85% and Yahoo 1.36%, according to StatCounter. In the United States, Google averaged 85.39% and Bing 9.53%.
United States search engine market share by year (2010 to 2026)
In the United States, Google averages 85.39% of search in 2026 so far, Bing 9.53%, Yahoo 2.77% and DuckDuckGo 1.73%, according to StatCounter's US data.
| Year | Bing | Yahoo | DuckDuckGo | |
|---|---|---|---|---|
| 2010 | 81.55% | 8.03% | 8.67% | 0.00% |
| 2011 | 81.13% | 8.24% | 8.98% | 0.00% |
| 2012 | 81.70% | 8.58% | 8.13% | 0.02% |
| 2013 | 80.16% | 9.67% | 8.42% | 0.05% |
| 2014 | 80.16% | 9.90% | 8.29% | 0.12% |
| 2015 | 81.40% | 8.45% | 8.68% | 0.32% |
| 2016 | 85.68% | 6.68% | 6.37% | 0.34% |
| 2017 | 87.23% | 6.60% | 5.01% | 0.53% |
| 2018 | 86.84% | 6.77% | 5.31% | 0.70% |
| 2019 | 87.94% | 6.14% | 4.45% | 1.15% |
| 2020 | 87.98% | 6.64% | 3.39% | 1.62% |
| 2021 | 88.11% | 5.96% | 3.07% | 2.42% |
| 2022 | 87.21% | 6.91% | 3.09% | 2.40% |
| 2023 | 88.57% | 6.64% | 2.45% | 1.93% |
| 2024 | 87.72% | 7.38% | 2.45% | 1.99% |
| 2025 | 86.10% | 7.98% | 2.99% | 2.32% |
| 2026* | 85.39% | 9.53% | 2.77% | 1.73% |
Desktop vs mobile: where searches happen
Search share is inseparable from device share. Mobile passed desktop as the largest source of global web traffic in 2017 (51.59% vs 43.74%) and has stayed on top since, peaking at 60.97% in 2024. In 2026 so far, mobile averages 52.54%, desktop 45.91% and tablet 1.55%, according to StatCounter.
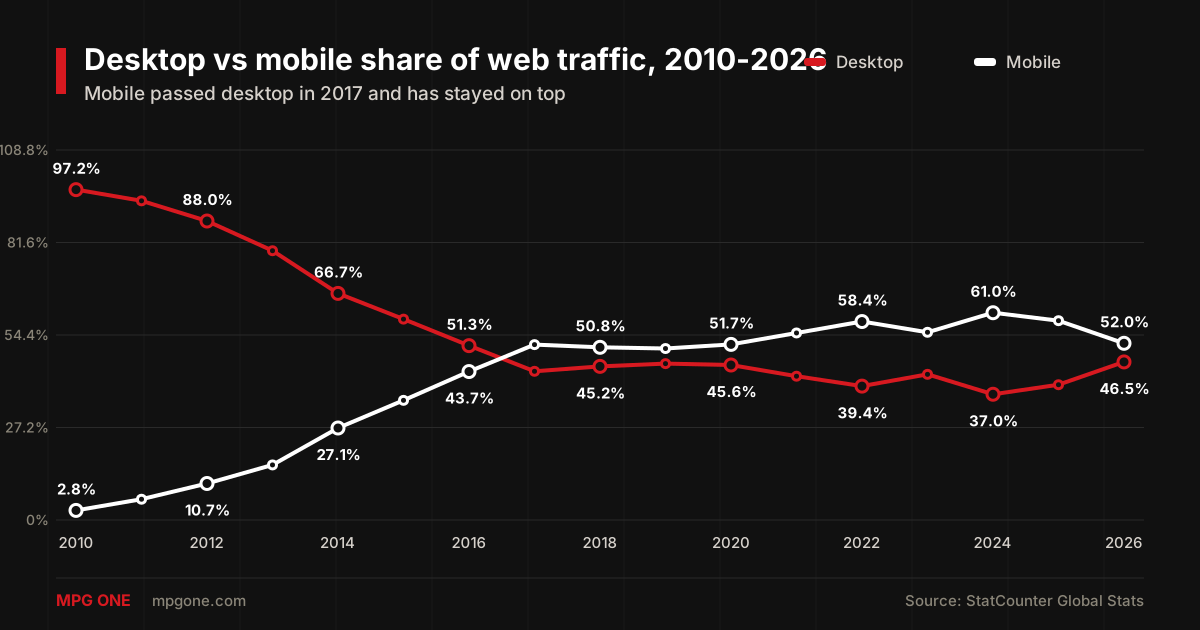
| Year | Desktop | Mobile | Tablet |
|---|---|---|---|
| 2010 | 97.18% | 2.82% | 0.00% |
| 2011 | 93.89% | 6.11% | 0.00% |
| 2012 | 87.95% | 10.74% | 1.31% |
| 2013 | 79.21% | 16.20% | 4.59% |
| 2014 | 66.66% | 27.06% | 6.28% |
| 2015 | 59.09% | 35.20% | 5.72% |
| 2016 | 51.29% | 43.67% | 5.03% |
| 2017 | 43.74% | 51.59% | 4.67% |
| 2018 | 45.19% | 50.80% | 4.01% |
| 2019 | 46.00% | 50.44% | 3.56% |
| 2020 | 45.59% | 51.66% | 2.75% |
| 2021 | 42.30% | 55.02% | 2.68% |
| 2022 | 39.38% | 58.38% | 2.25% |
| 2023 | 42.85% | 55.22% | 1.92% |
| 2024 | 36.99% | 60.97% | 2.04% |
| 2025 | 39.79% | 58.63% | 1.58% |
| 2026* | 45.91% | 52.54% | 1.55% |
What about ChatGPT and AI search?
Traditional market share trackers measure referrals from search result pages, so conversational AI tools do not appear in the tables above even though they now answer a meaningful share of question type queries. Three things are clear from the data that is measurable: Google's worldwide average fell to 89.92% in 2025, its lowest yearly figure since 2014; Bing, the engine most aggressively fused with an AI assistant, has grown about 63% in relative share since 2023 (2.98% to 4.85%); and zero click behavior keeps rising (see our SEO statistics from 2010 to 2026 for the click data). For how this affects SEO strategy, see our guide on whether Google AI Mode signals the end of organic SEO.
Sources and methodology
- StatCounter: Search engine market share (worldwide)
- StatCounter: Search engine market share (United States)
- StatCounter: Desktop vs mobile vs tablet share
Yearly figures are the mean of StatCounter's monthly values for that calendar year, all platforms combined. October 2026 is excluded because the month is still in progress. Yandex includes both international and Russian StatCounter series. Figures under 0.5% are subject to larger measurement noise.
Helpful next steps
Turn the idea into something useful
When this topic becomes part of a real website, workflow, campaign, or AI system, these MPG ONE pages are the natural places to continue.
Build private AI assistants, workflow automation, knowledge systems, and reporting layers.
Marketing and SEO servicesConnect technical SEO, content strategy, campaigns, analytics, and conversion-focused pages.
AI agent development servicesDesign tool-using AI agents with memory, retrieval, permissions, and human review.
Generative AI development servicesBuild generative AI workflows for content, documents, knowledge, and brand-safe operations.
Custom AI solutionsCreate a custom AI system around your data, tools, permissions, and operating model.